Pages navigator
Stocks Auto Scanners Documentation

End-of-Day Trading Algorithm:
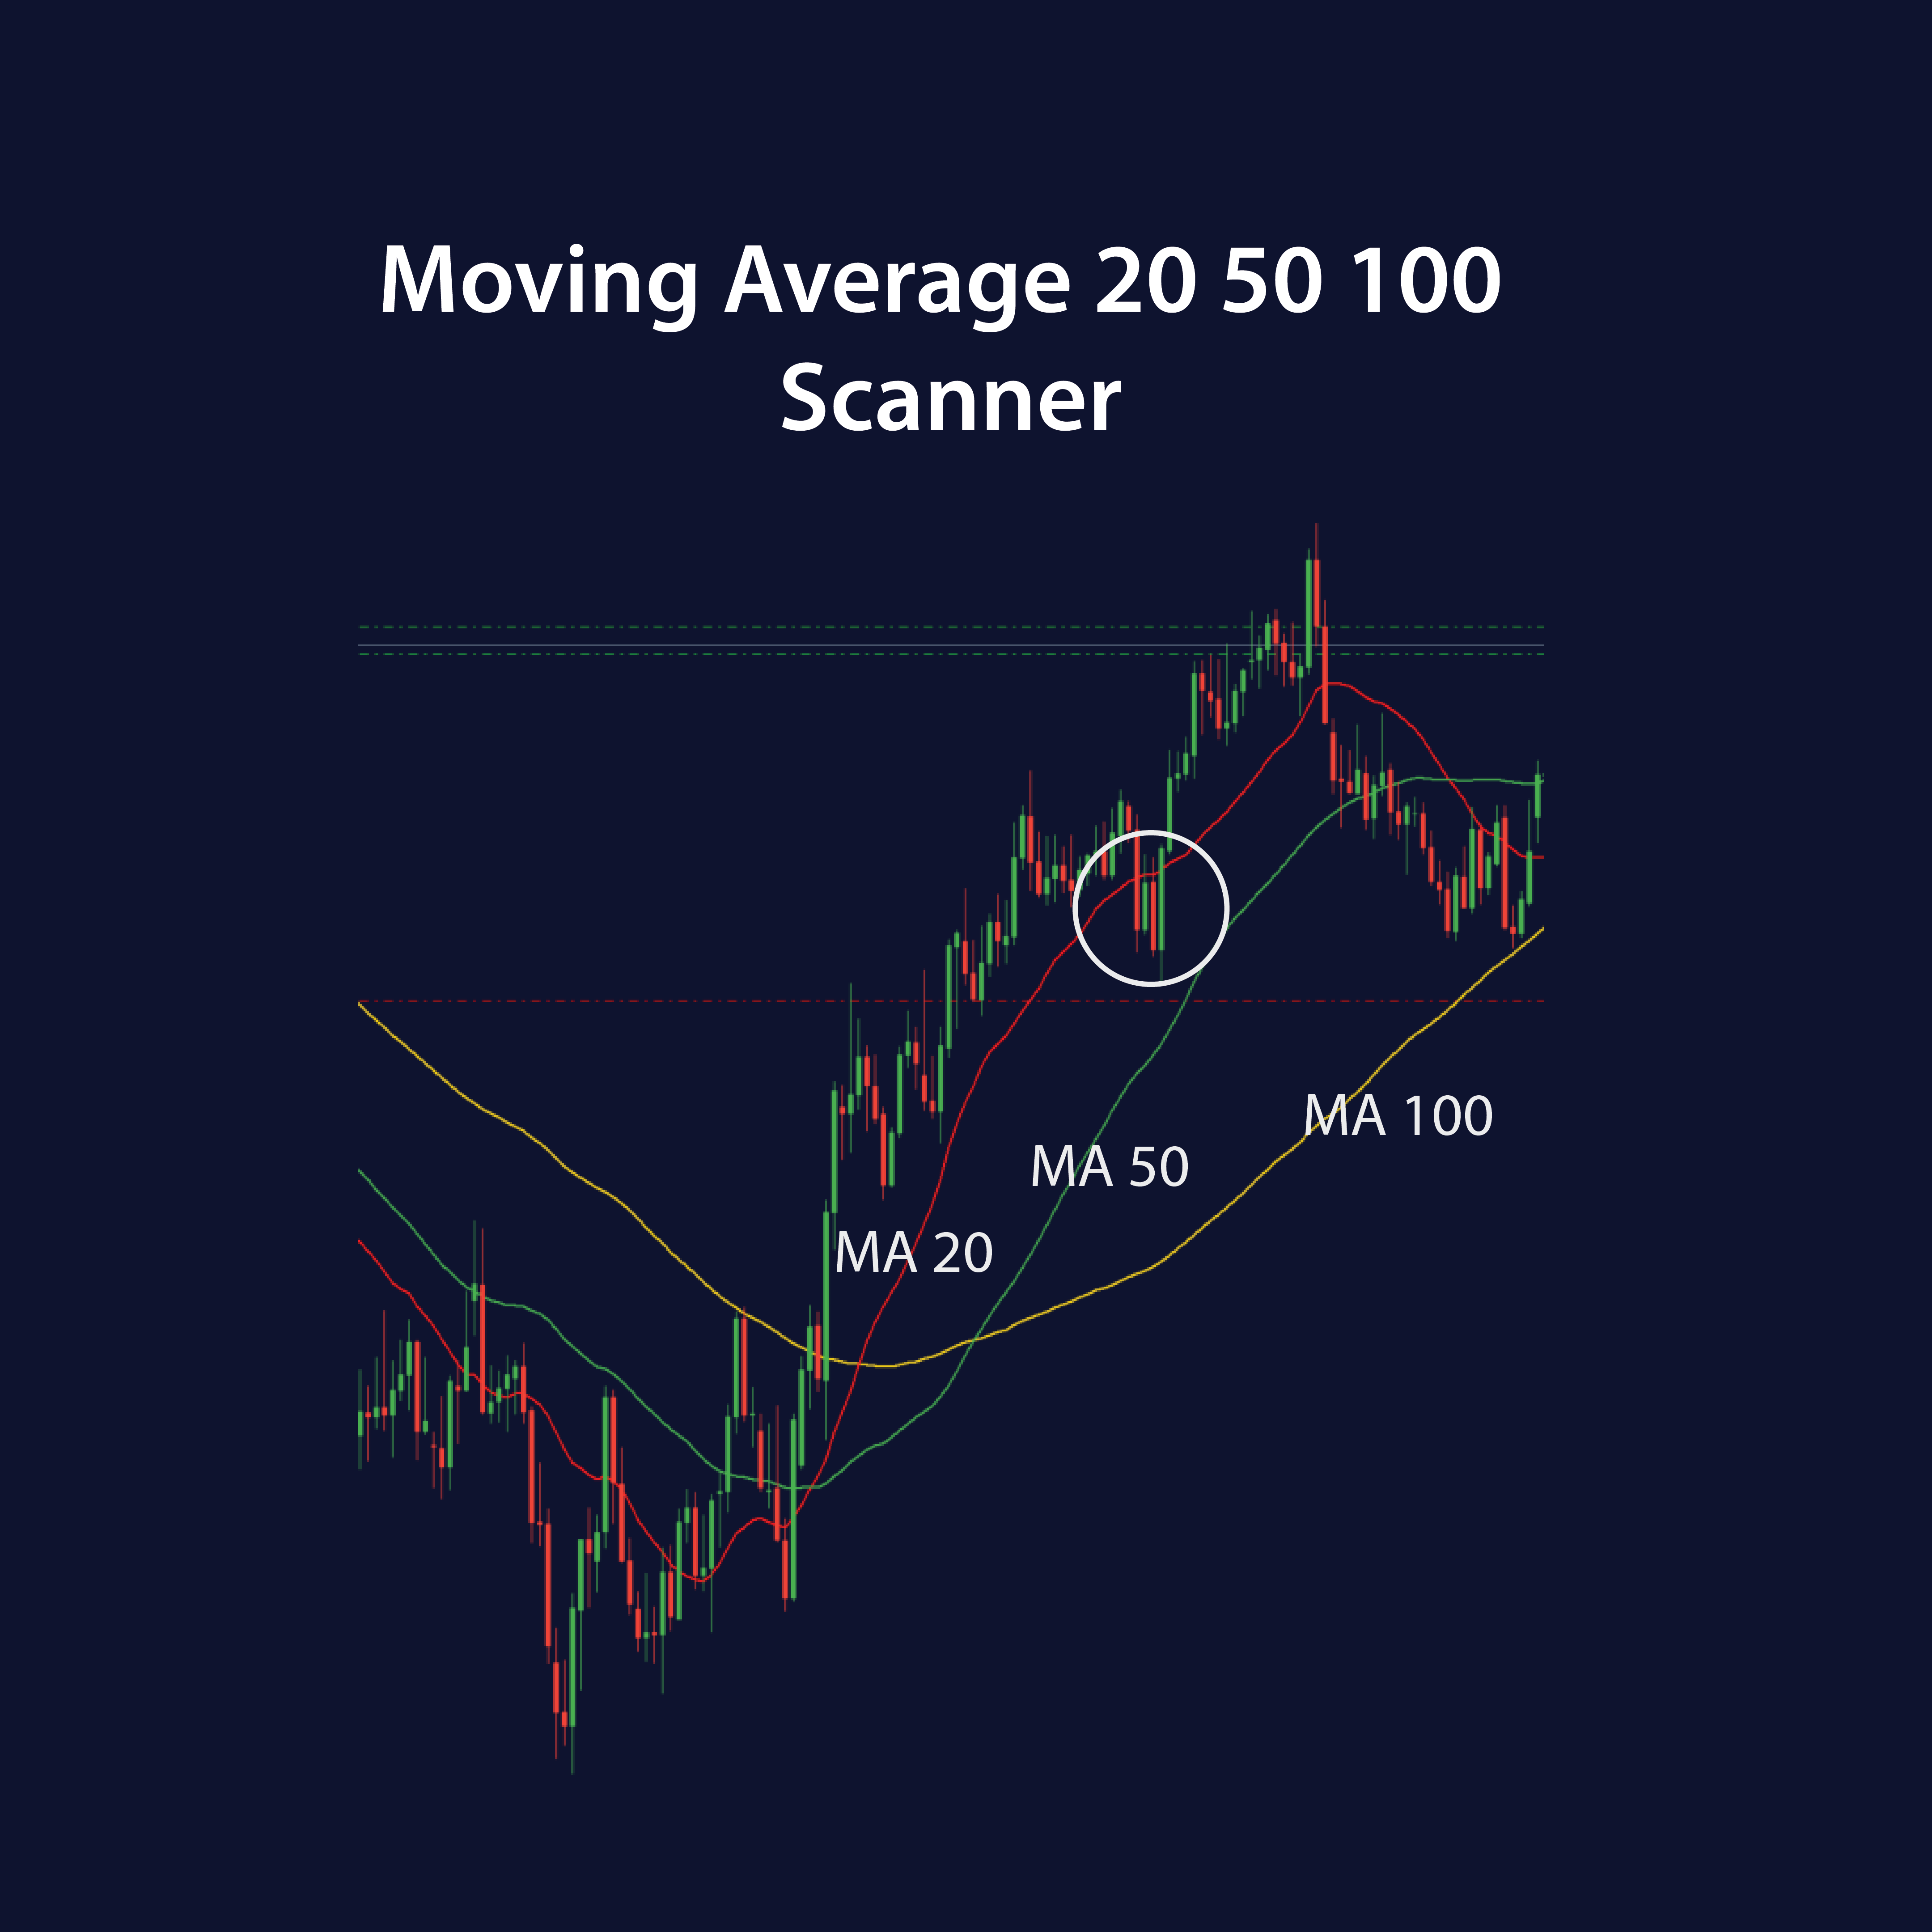
This algorithm focuses on daily prices to identify up to 10 stocks meeting specific trend conditions.
Moving Average Position Check:
The algorithm verifies the alignment of three key moving averages (20, 50, and 100 periods) as follows:
- 20-period average above 50-period
- 50-period above 100-period
This setup confirms an upward trend.
Candle Position Relative to 20-Period Moving Average:
Recent candles must stay above the 20-period average, with the latest candle closing below it. This setup indicates a slight pullback within an uptrend, which could present an entry opportunity.
Daily Stock Selection (Max 10):
When all conditions are met, up to 10 qualifying stocks are displayed, highlighting the strongest signals for the day. This focused approach ensures manageable insights aligned with end-of-day trading strategies.

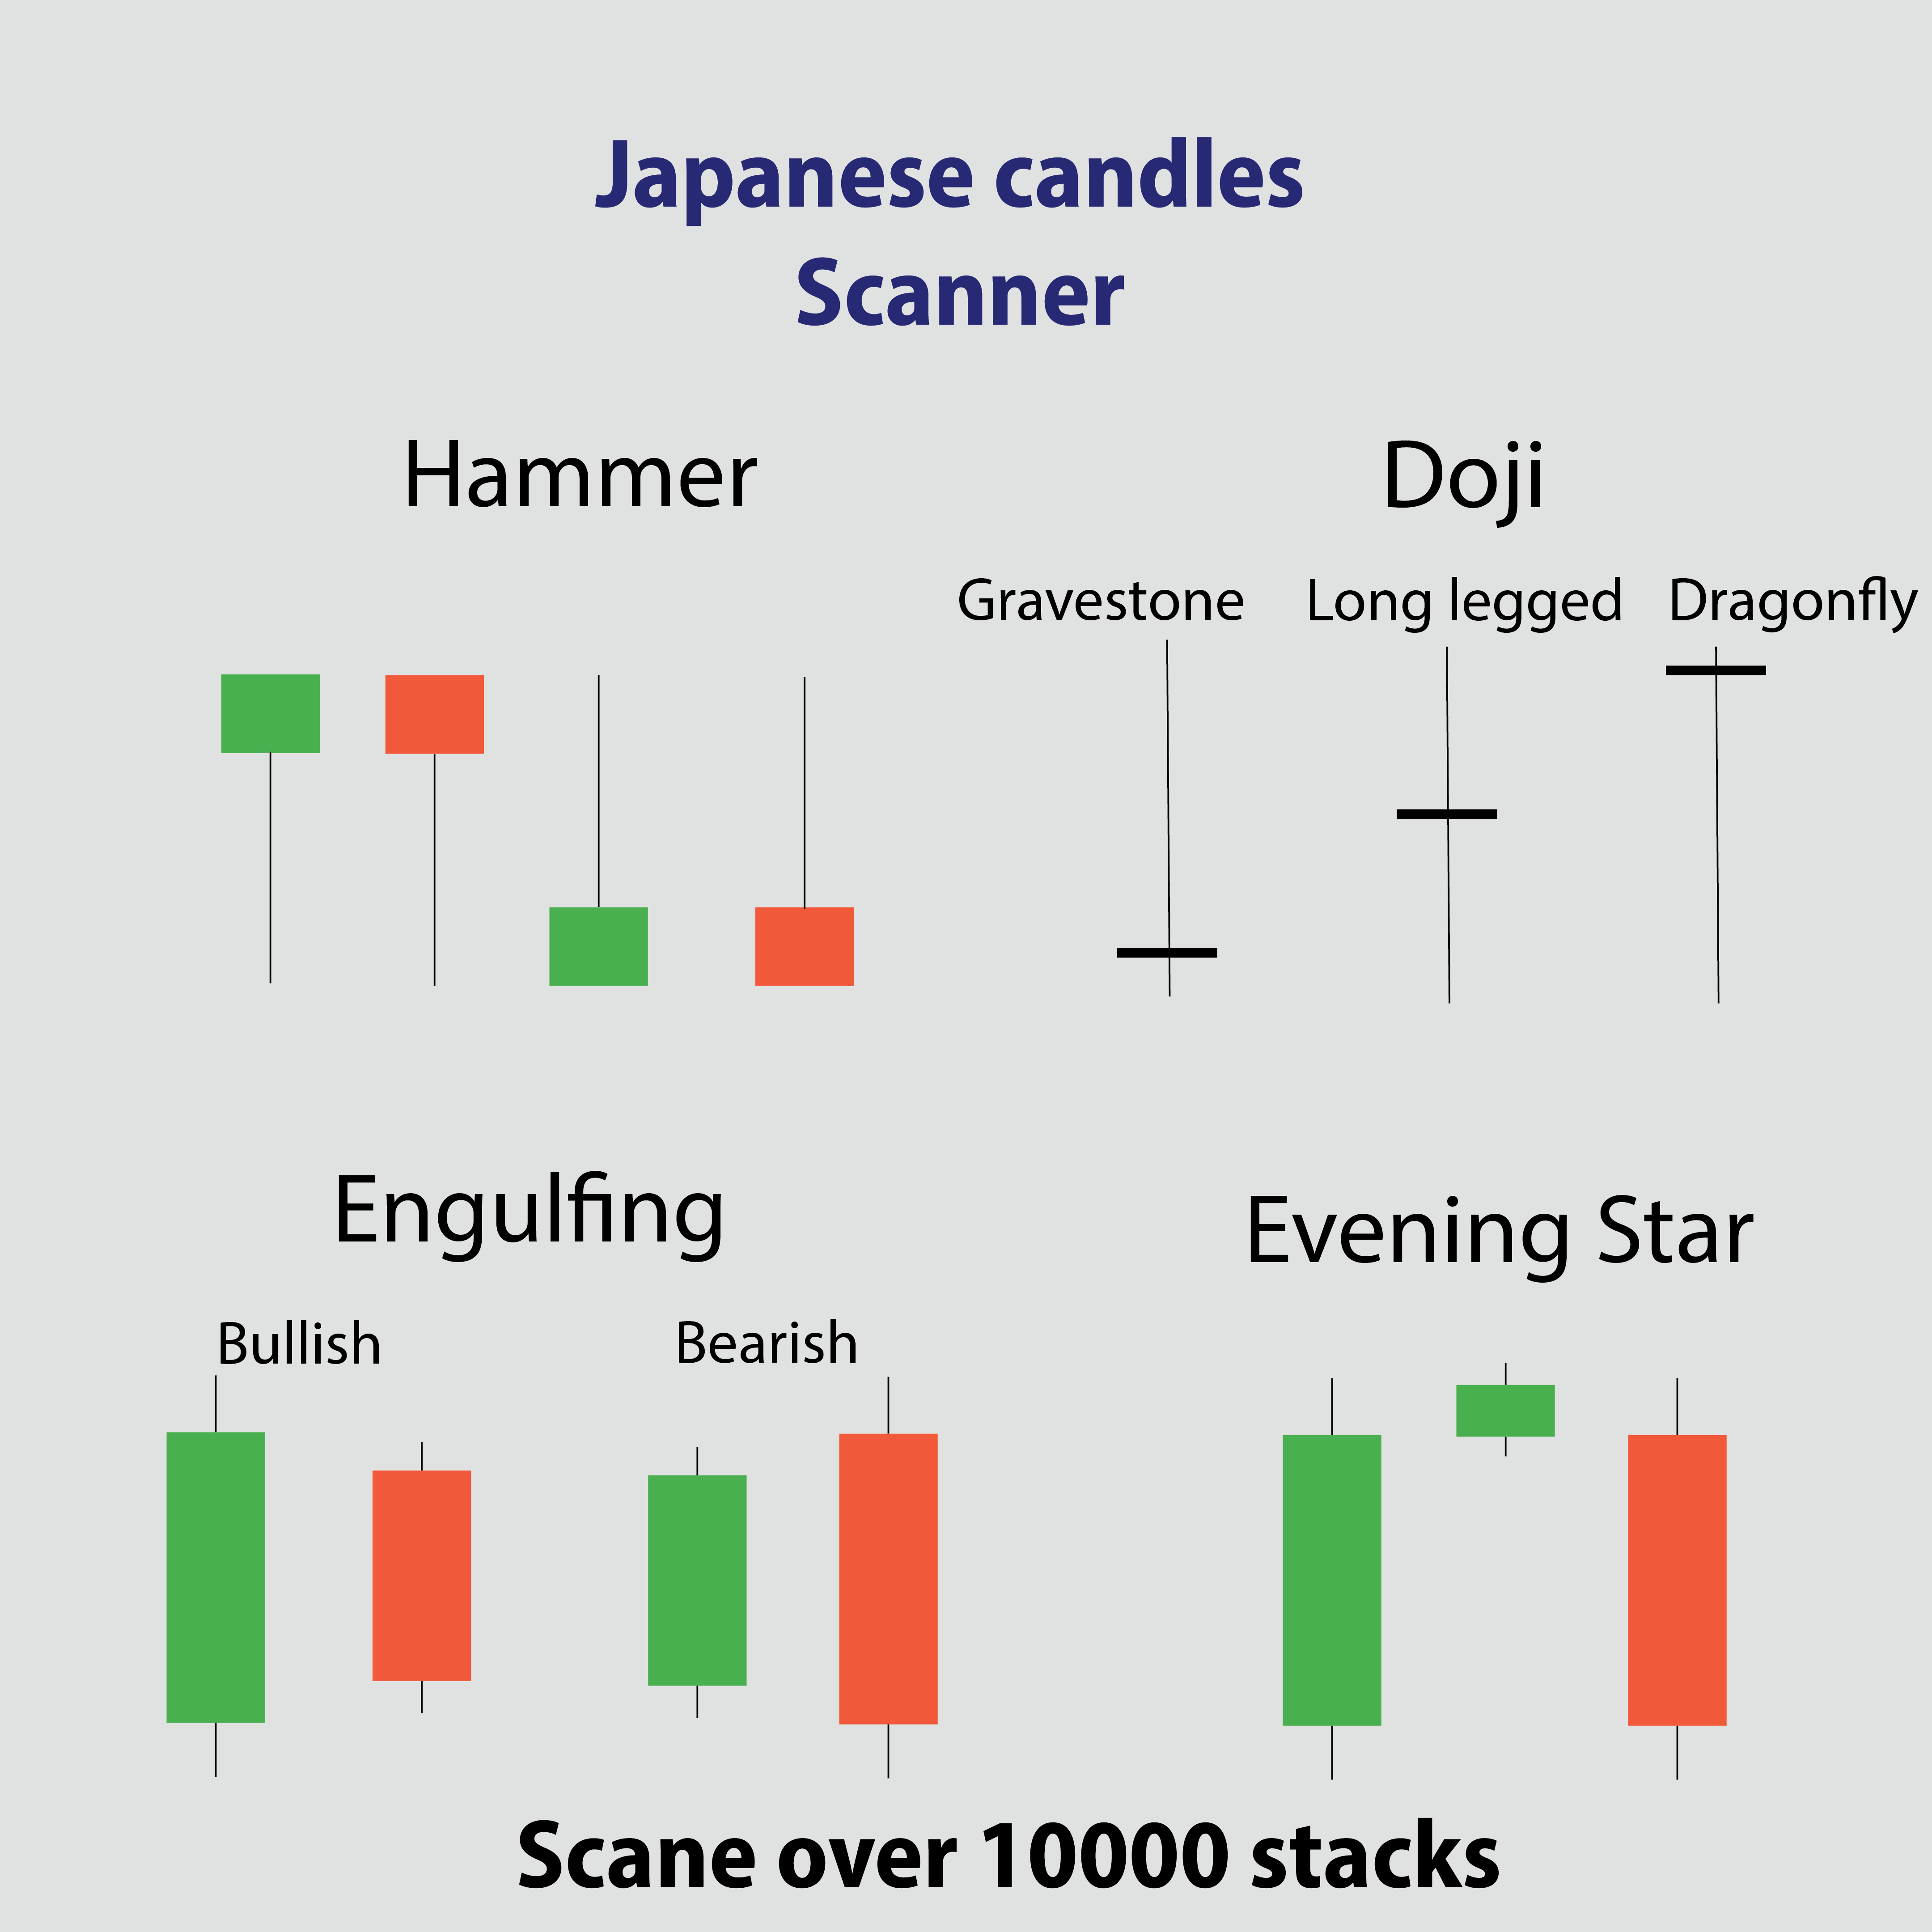
The Japanese candlestick scanner can identify 10 different candlestick patterns, organized into several categories:
- Hammer Candle – Recognizes 4 variations of the hammer pattern, which indicate a potential bullish reversal, especially when they appear after a downtrend.
- Doji Candle – Identifies 3 types of Doji patterns, where the opening and closing prices are almost identical. These patterns often signal indecision in the market and can indicate a possible trend reversal.
- Engulfing Candle – Detects 2 types of engulfing patterns, where one candle "engulfs" the previous one. The two types are:
- Bullish Engulfing – Indicates a potential upward trend.
- Bearish Engulfing – Indicates a possible downward trend.
- Evening Star – A three-candle pattern that typically appears after an uptrend and suggests a possible bearish reversal.
This scanner is a valuable tool in technical analysis, providing insights into potential trend shifts in the stock market.

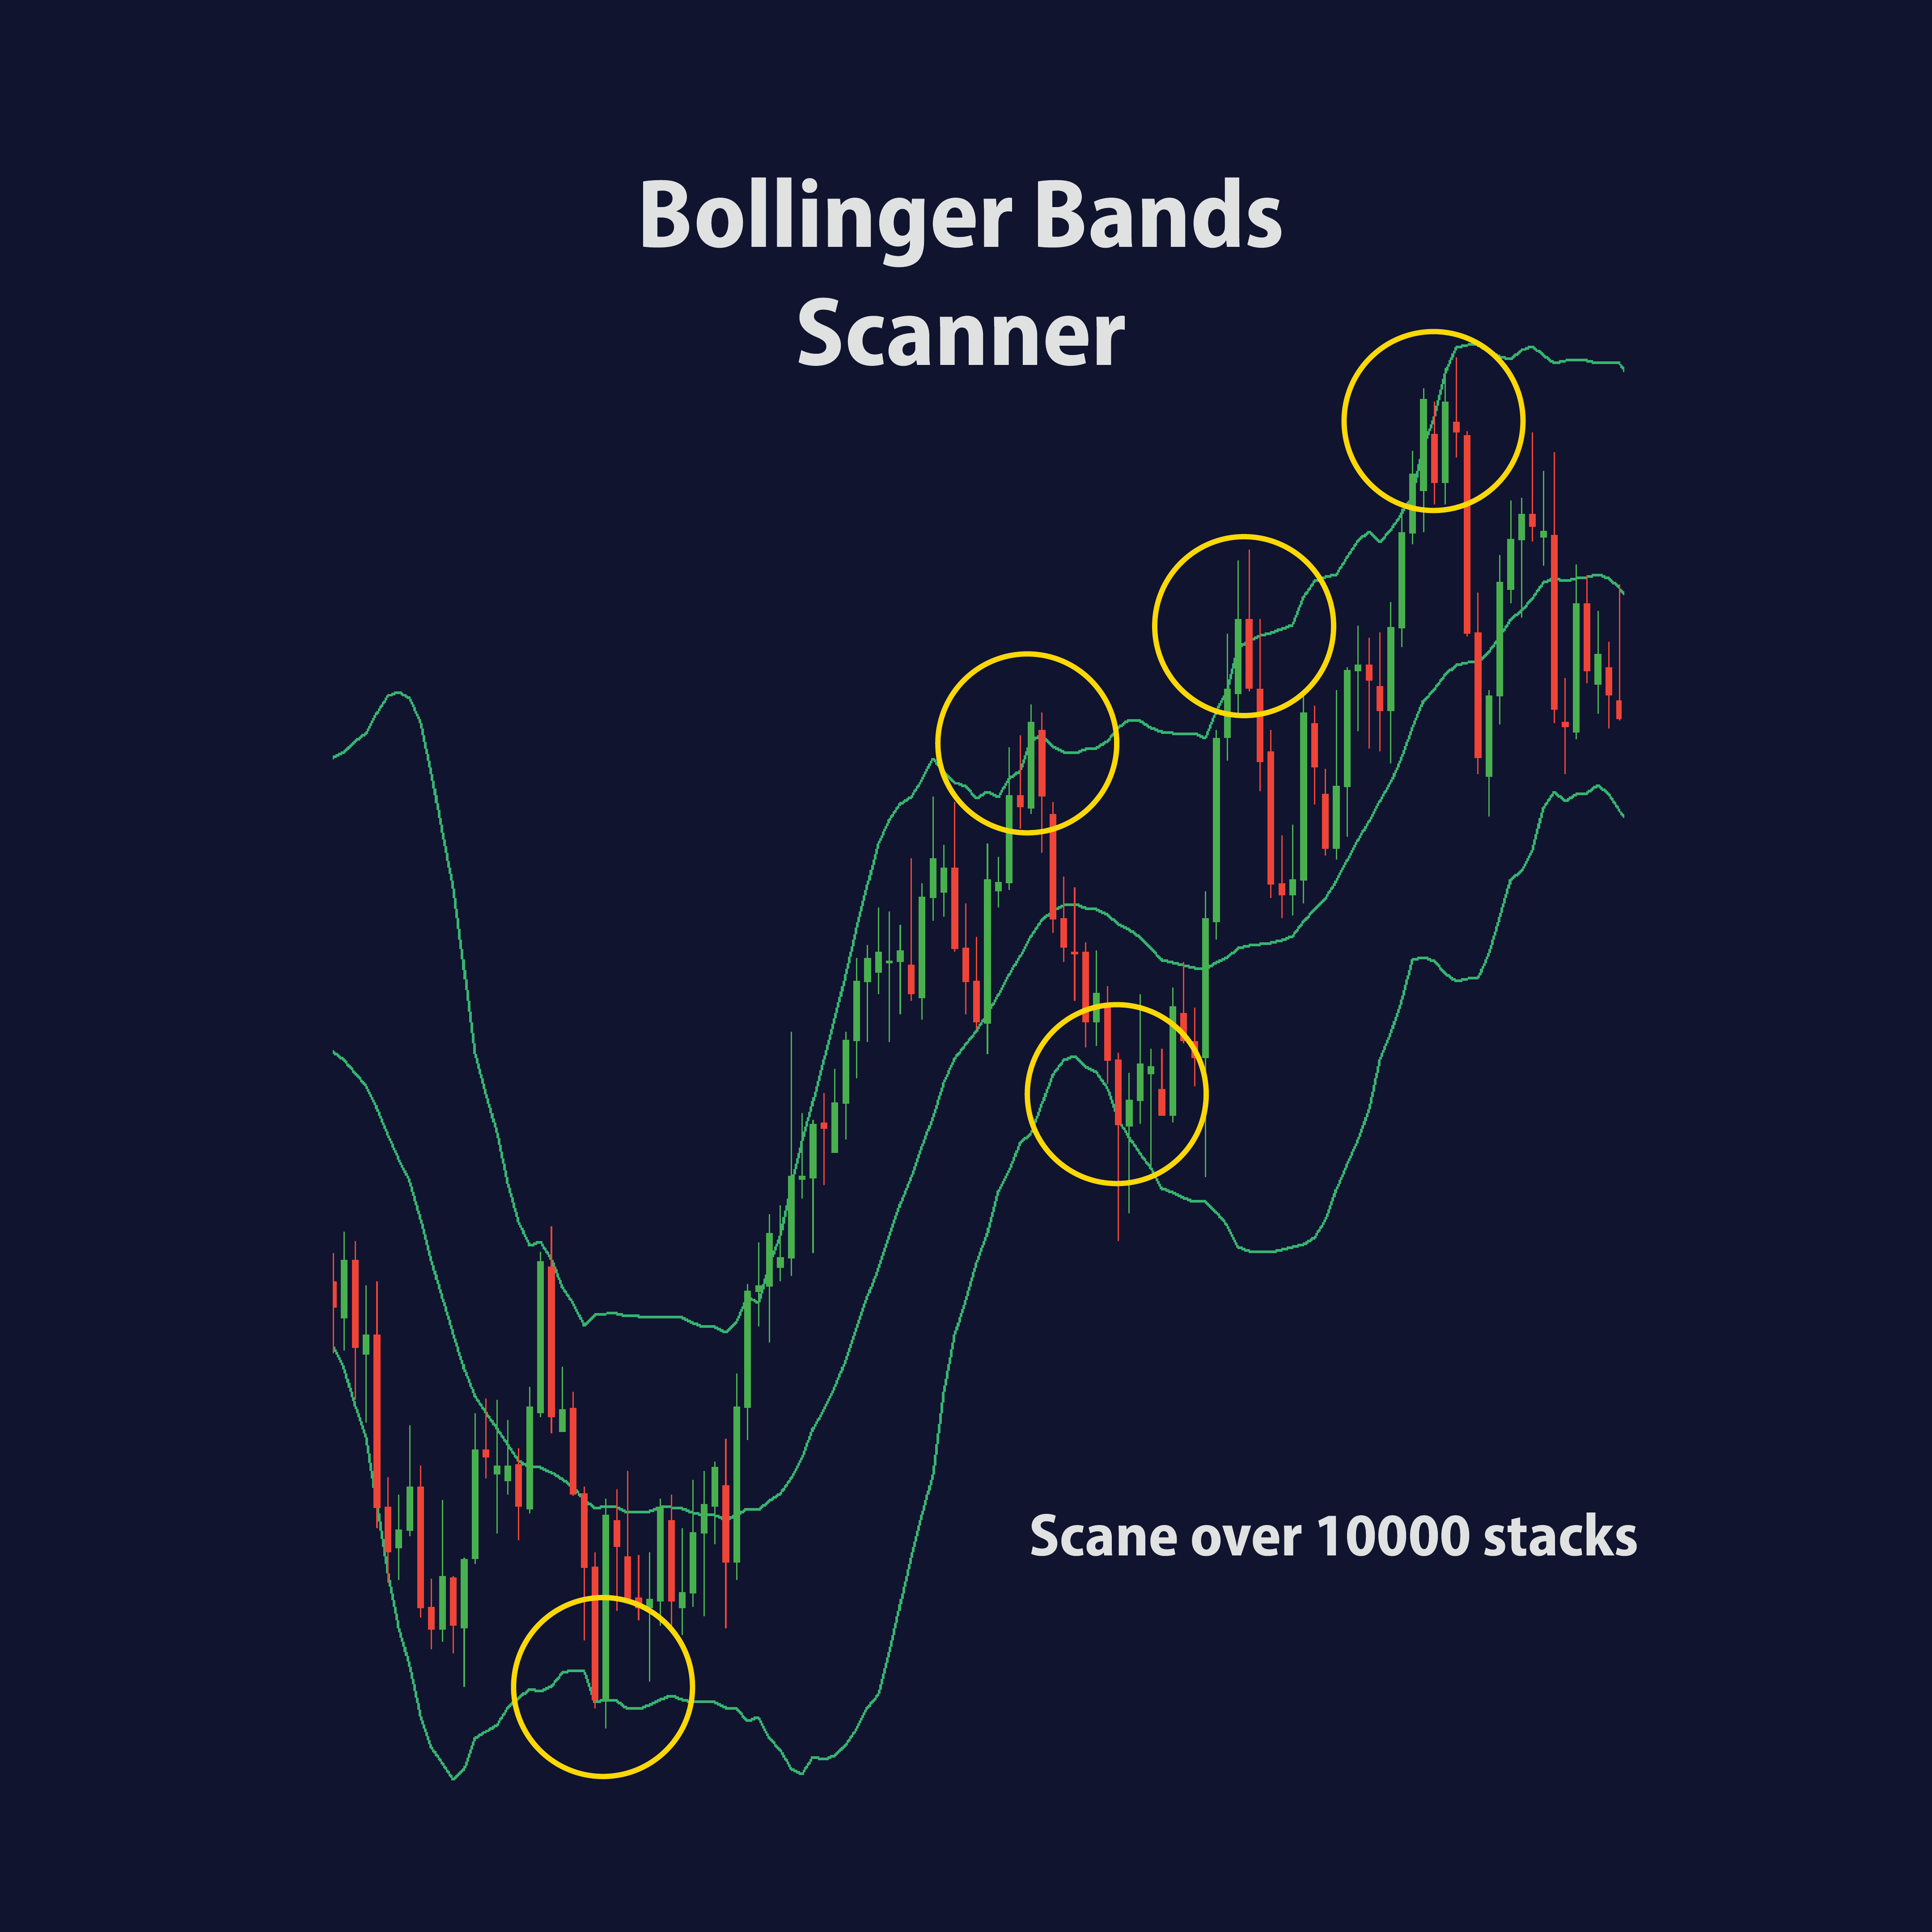
Bollinger Bands Signal Detection: This advanced scanner is designed to capture key moments when a candle decisively crosses one of the Bollinger Bands, indicating potential breakout or reversal points. The significance of these crossings is highlighted as follows:
- When a candle crosses above the upper Bollinger Band, it signals a potential overbought condition. The subsequent candle closing back within the band often hints at an impending correction or short-term resistance.
- Conversely, if a candle pierces below the lower Bollinger Band, it may suggest an oversold condition. A close back above the band in the next candle can indicate a potential recovery or support level.
By pinpointing these critical moments, the scanner provides insights into potential entry or exit points, empowering traders to react swiftly to evolving market dynamics.

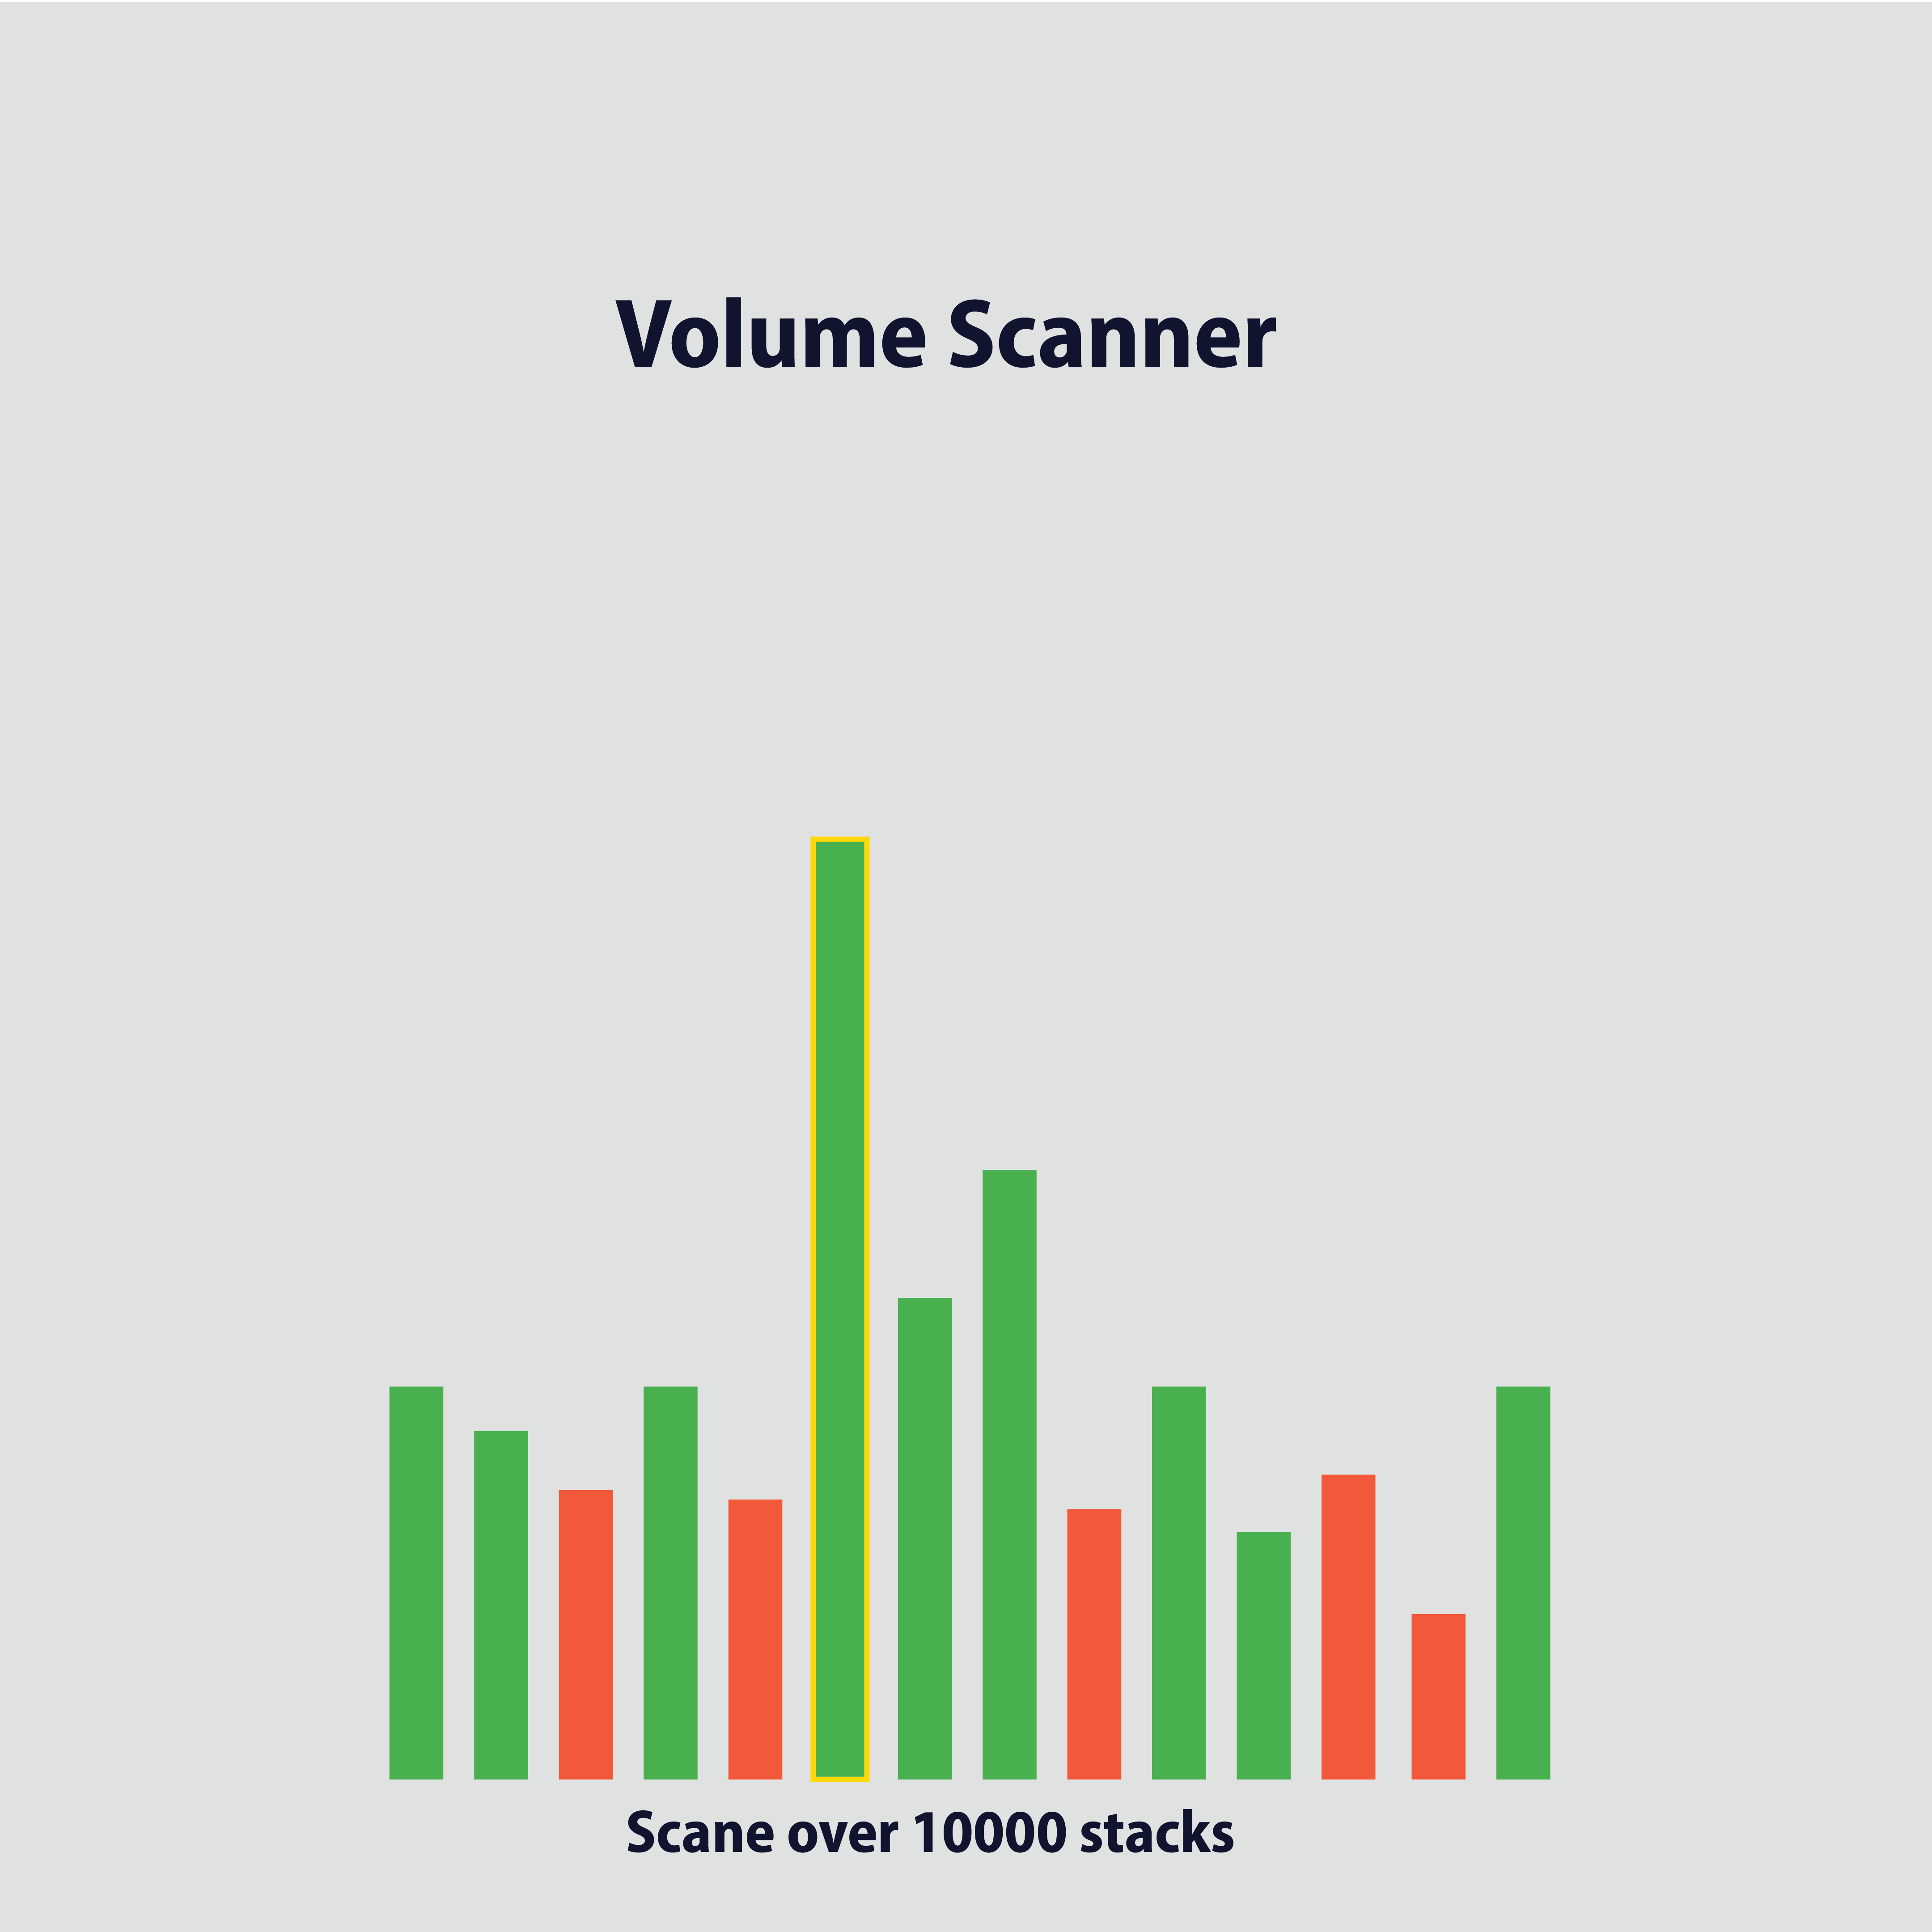
The Volume Scanner provides insights based on trading volume and price movements, using several important checks:
- Crossing the 10-Day Volume Average – The scanner checks if the current volume surpasses the 10-day average. This indicates unusual activity, often linked to increased buying or selling interest.
- Percentage Difference from Average Price – Measures the percentage difference between the current price and the average price. It identifies the highest and lowest deviations, helping to pinpoint when the price significantly deviates from the norm.
- Price Jump Over 50% – Detects if the price has surged by more than 50%. Such jumps can indicate a strong bullish sentiment or rapid changes in demand.
- Price Jump Over 100% – Identifies instances when the price has more than doubled. A 100% increase often reflects a major shift in market sentiment or substantial news affecting the asset.
This Volume Scanner is a powerful tool for identifying high-interest periods, tracking major price movements, and capturing unusual market behavior that could signify a new trend or reversal.